14  Tournament

library("tidyverse"); theme_set(theme_bw())
Warning: package 'purrr' was built under R version 4.4.1
── Attaching core tidyverse packages ──────────────────────── tidyverse 2.0.0 ──
✔ dplyr     1.1.4.9000     ✔ readr     2.1.5     
✔ forcats   1.0.0          ✔ stringr   1.5.1     
✔ ggplot2   3.5.1          ✔ tibble    3.2.1     
✔ lubridate 1.9.3          ✔ tidyr     1.3.1     
✔ purrr     1.0.4          
── Conflicts ────────────────────────────────────────── tidyverse_conflicts() ──
✖ dplyr::filter() masks stats::filter()
✖ dplyr::lag()    masks stats::lag()
ℹ Use the conflicted package (<http://conflicted.r-lib.org/>) to force all conflicts to become errors
library("ggResidpanel")
library("emmeans")
Welcome to emmeans.
Caution: You lose important information if you filter this package's results.
See '? untidy'
library("lme4")
Loading required package: Matrix

Attaching package: 'Matrix'

The following objects are masked from 'package:tidyr':

    expand, pack, unpack
library("DT")

options(width = 120)

source("../../R/construct_matrix.R")

14.1 FIRST Robotics Challenge (FRC) 2025 World Championships Hopper Division

14.1.1 Qualifications

tmp <- read_csv("../../data/frc/2025_champs_hopper_division.csv")  
Rows: 125 Columns: 10
── Column specification ────────────────────────────────────────────────────────────────────────────────────────────────
Delimiter: ","
chr (2): Match, Start Time
dbl (8): Red 1, Red 2, Red 3, Blue 1, Blue 2, Blue 3, Red Final, Blue Final

ℹ Use `spec()` to retrieve the full column specification for this data.
ℹ Specify the column types or set `show_col_types = FALSE` to quiet this message.
# Create factor for all teams
teams <- tmp |>
  select(`Red 1`:`Blue 3`) |>
  pivot_longer(everything()) |>
  pull(value) |>
  unique() |>
  sort()

champs2025hopper <- tmp |>
  mutate(
    `Red 1`  = factor(`Red 1`,  levels = teams),
    `Red 2`  = factor(`Red 2`,  levels = teams),
    `Red 3`  = factor(`Red 3`,  levels = teams),
    `Blue 1` = factor(`Blue 1`, levels = teams),
    `Blue 2` = factor(`Blue 2`, levels = teams),
    `Blue 3` = factor(`Blue 3`, levels = teams)
  )

nteams <- length(teams)
# Construct model matrices
X_red <- 
  construct_matrix(champs2025hopper, "Red 1", nteams) +
  construct_matrix(champs2025hopper, "Red 2", nteams) +
  construct_matrix(champs2025hopper, "Red 3", nteams) 

X_blue <- 
  construct_matrix(champs2025hopper, "Blue 1", nteams) +
  construct_matrix(champs2025hopper, "Blue 2", nteams) +
  construct_matrix(champs2025hopper, "Blue 3", nteams) 

# Checks
table(rowSums(X_red))

  3 
125 
colSums(X_red) + colSums(X_blue)
 [1] 10 10 10 10 10 10 10 10 10 10 10 10 10 10 10 10 10 10 10 10 10 10 10 10 10 10 10 10 10 10 10 10 10 10 10 10 10 10
[39] 10 10 10 10 10 10 10 10 10 10 10 10 10 10 10 10 10 10 10 10 10 10 10 10 10 10 10 10 10 10 10 10 10 10 10 10 10
# Margin of victory
margin <- champs2025hopper$`Red Final` - champs2025hopper$`Blue Final`
X      <- X_red - X_blue

# Fit model
m <- lm(margin ~ 0 + X)
(sd <- summary(m)$sigma)
[1] 29.47821
# Calculate team rating
champs2025hopper_margin <- data.frame(
  team   = teams,
  rating = coef(m)
) |>
  mutate(
    rating = ifelse(is.na(rating), 0, rating),
    rating = rating - mean(rating),
    team   = factor(team, levels = team[order(rating)])
  ) |>
  arrange(desc(team))

champs2025hopper_margin |> 
  datatable(filter = "top", 
            rownames = FALSE) |>
  formatRound(columns = "rating", digits = 1)

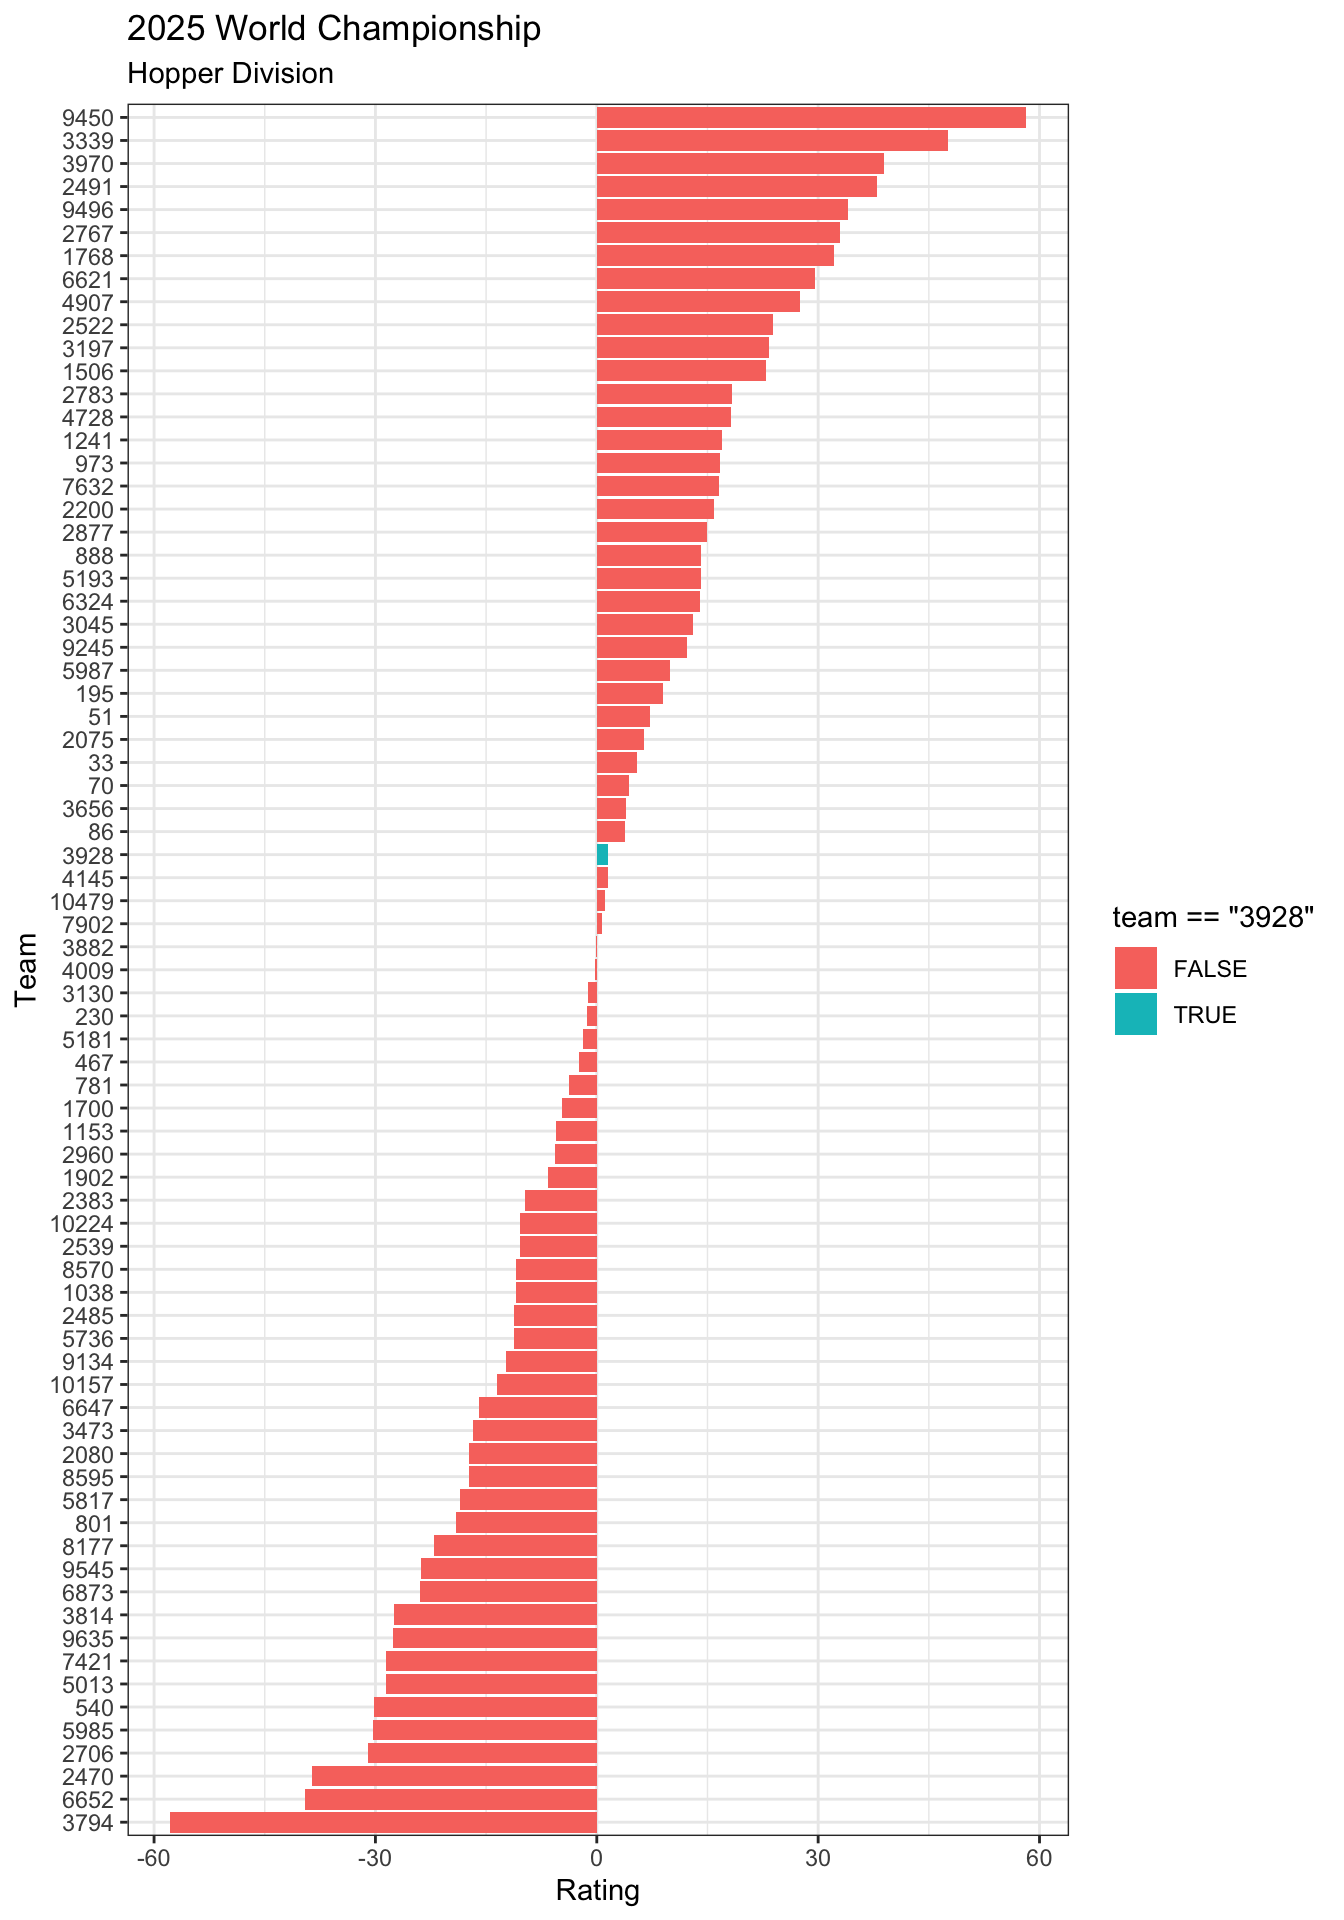
Let’s plot the teams

ggplot(champs2025hopper_margin,
       aes(
         x = rating,
         y = team
       )) +
  geom_bar(stat="identity", aes(fill = team == "3928")) +
  theme(legend.position = NULL) +
  labs(
    x = "Rating",
    y = "Team",
    title = "2025 World Championship",
    subtitle = "Hopper Division"
  )

14.1.2 Playoffs

alliance <- tribble(
  ~number, ~team1, ~team2, ~team3, ~team4,
  1, 1768, 2767, 2877, 4145,
  2, 2200, 3339, 1153, 2491,
  3, 4728, 3970, 3045, 8570,
  4, 6621, 9450, 2539,  230,
  5, 9245,   33,  195, 1506,
  6, 4907, 9496, 6324, 3656,
  7, 7632, 1241, 3197,   51,
  8, 2075,  973, 2522, 1902
) |>
  mutate(
    team1 = factor(team1, levels = teams),
    team2 = factor(team2, levels = teams),
    team3 = factor(team3, levels = teams),
    team4 = factor(team4, levels = teams),
    
    strength = 
      champs2025hopper_margin$rating[as.numeric(team1)] +
      champs2025hopper_margin$rating[as.numeric(team2)] +
      champs2025hopper_margin$rating[as.numeric(team3)] 
  ) 

alliance
# A tibble: 8 × 6
  number team1 team2 team3 team4 strength
   <dbl> <fct> <fct> <fct> <fct>    <dbl>
1      1 1768  2767  2877  4145     24.1 
2      2 2200  3339  1153  2491     32.0 
3      3 4728  3970  3045  8570     -9.91
4      4 6621  9450  2539  230     -38.2 
5      5 9245  33    195   1506     63.7 
6      6 4907  9496  6324  3656    -53.4 
7      7 7632  1241  3197  51       -1.49
8      8 2075  973   2522  1902     44.3 
probability <- matrix(NA, 8, 8)

for (r in 1:8) {
  for (c in 1:8) {
    probability[r,c] <- 1 - pnorm(
      0, 
      mean = alliance$strength[r] - alliance$strength[c],
      sd   = sd
    )
  }
}
diag(probability) <- NA

probability |> round(3)
      [,1]  [,2]  [,3]  [,4]  [,5]  [,6]  [,7]  [,8]
[1,]    NA 0.395 0.876 0.983 0.090 0.996 0.807 0.246
[2,] 0.605    NA 0.922 0.991 0.141 0.998 0.872 0.338
[3,] 0.124 0.078    NA 0.831 0.006 0.930 0.388 0.033
[4,] 0.017 0.009 0.169    NA 0.000 0.697 0.106 0.003
[5,] 0.910 0.859 0.994 1.000    NA 1.000 0.986 0.744
[6,] 0.004 0.002 0.070 0.303 0.000    NA 0.039 0.000
[7,] 0.193 0.128 0.612 0.894 0.014 0.961    NA 0.060
[8,] 0.754 0.662 0.967 0.997 0.256 1.000 0.940    NA
match <- tribble(
  ~number, ~red, ~blue, 
  1, 1, 8,
  2, 4, 5,
  3, 2, 7,
  4, 3, 6
)
simulate_playoffs <- function(probability, sim) {
  # Match 1
  u1 <- runif(1)
  match1_winner <- ifelse(u1 < probability[1,8], 1, 8)
  match1_loser  <- ifelse(u1 < probability[1,8], 8, 1)
  
  # Match 2
  u2 <- runif(1)
  match2_winner <- ifelse(u2 < probability[4,5], 4, 5)
  match2_loser  <- ifelse(u2 < probability[4,5], 5, 4)
  
  # Match 3
  u3 <- runif(1)
  match3_winner <- ifelse(u3 < probability[2,7], 2, 7)
  match3_loser  <- ifelse(u3 < probability[2,7], 7, 2)
  
  # Match 4
  u4 <- runif(1)
  match4_winner <- ifelse(u4 < probability[3,6], 3, 6)
  match4_loser  <- ifelse(u4 < probability[3,6], 6, 3)
  
  # Match 5
  u5 <- runif(1)
  match5_winner <- ifelse(u5 < probability[match1_loser, match2_loser], match1_loser, match2_loser)
  exit_round <- data.frame(
    number = ifelse(u5 < probability[match1_loser, match2_loser], match2_loser, match1_loser),
    round = 2
  )
                             
  
  # Match 6
  u6 <- runif(1)
  match6_winner <- ifelse(u6 < probability[match3_loser, match4_loser], match3_loser, match4_loser)
  exit_round <- exit_round |>
    rbind(data.frame(
    number = ifelse(u6 < probability[match3_loser, match4_loser], match4_loser, match3_loser),
    round = 2
  ))
  
  # Match 7
  u7 <- runif(1)
  match7_winner <- ifelse(u7 < probability[match1_winner, match2_winner], match1_winner, match2_winner)
  match7_loser  <- ifelse(u7 < probability[match1_winner, match2_winner], match2_winner, match1_winner)
  
  # Match 8
  u8 <- runif(1)
  match8_winner <- ifelse(u8 < probability[match3_winner, match4_winner], match3_winner, match4_winner)
  match8_loser  <- ifelse(u8 < probability[match3_winner, match4_winner], match4_winner, match3_winner)
  
  # Match 9
  u9 <- runif(1)
  match9_winner <- ifelse(u9 < probability[match6_winner, match7_loser], match6_winner, match7_loser)
  exit_round <- exit_round |>
    rbind(data.frame(
    number = ifelse(u9 < probability[match6_winner, match7_loser], match7_loser, match6_winner),
    round = 3
  ))
  
  # Match 10
  u10 <- runif(1)
  match10_winner <- ifelse(u10 < probability[match5_winner, match8_loser], match5_winner, match8_loser)
  exit_round <- exit_round |>
    rbind(data.frame(
    number = ifelse(u10 < probability[match5_winner, match8_loser], match8_loser, match5_winner),
    round = 3
  ))
  
  
  # Match 11
  u11 <- runif(1)
  match11_winner <- ifelse(u11 < probability[match7_winner, match8_winner], match7_winner, match8_winner)
  match11_loser  <- ifelse(u11 < probability[match7_winner, match8_winner], match8_winner, match7_winner)
  
  # Match 12
  u12 <- runif(1)
  match12_winner <- ifelse(u12 < probability[match10_winner, match9_winner], match10_winner, match9_winner)
  exit_round <- exit_round |>
    rbind(data.frame(
    number = ifelse(u12 < probability[match10_winner, match9_winner], match9_winner, match10_winner),
    round = 4
  ))
  
  # Match 13
  u13 <- runif(1)
  match13_winner <- ifelse(u13 < probability[match12_winner, match11_loser], match12_winner, match11_loser)
  exit_round <- exit_round |>
    rbind(data.frame(
    number = ifelse(u13 < probability[match12_winner, match11_loser], match11_loser, match12_winner),
    round = 5
  ))
  
  # Finals
  uf_1 <- runif(1)
  final_game1_w <- ifelse(uf_1 < probability[match11_winner, match13_winner], match11_winner, match13_winner)
  uf_2 <- runif(1)
  final_game2_w <- ifelse(uf_2 < probability[match11_winner, match13_winner], match11_winner, match13_winner)
  if (!(final_game1_w == final_game2_w)) {
    uf_3 <- runif(1)
    final_game3_w <- ifelse(uf_3 < probability[match11_winner, match13_winner], match11_winner, match13_winner)
  }
  winner   <- ifelse(!exists("final_game3_w"), final_game2_w, final_game3_w)
  runnerup <- setdiff(c(match11_winner, match13_winner), winner)
  
  exit_round <- exit_round |>
    rbind(data.frame(
    number = c(runnerup, winner),
    round = c(6,7)
  ))
  
  exit_round$sim = sim
  return(exit_round)
}


# Large number of simulations
n_sims <- 1000

exit_round <- list()
for (i in 1:n_sims) {
  exit_round[[i]] <- simulate_playoffs(probability, i)
}

exits <- bind_rows(exit_round) |> 
  select(sim, round, number) |> 
  arrange(sim, round, number)

Calculate probability of winning the tournament with uncertainty.

p <- exits |>
  filter(round == 7) |>
  group_by(number) |>
  summarize(n = n(), .groups = "drop") |>
  mutate(p = n / n_sims,
         lcl = p - 2 * sqrt(p*(1-p)/n),
         ucl = p + 2 * sqrt(p*(1-p)/n)) |>
  arrange(desc(p))

p
# A tibble: 4 × 5
  number     n     p     lcl    ucl
   <dbl> <int> <dbl>   <dbl>  <dbl>
1      5   810 0.81   0.782  0.838 
2      8   143 0.143  0.0845 0.202 
3      2    42 0.042 -0.0199 0.104 
4      1     5 0.005 -0.0581 0.0681

Calculate expected points.

points <- exits |>
  mutate(
    points = case_when(
      round == 7 ~ 30,
      round == 6 ~ 15,
      round == 5 ~ 10,
      round == 4 ~  5,
      round == 3 ~  3,
      round == 2 ~  1
    )
  ) |>
  group_by(number) |>
  summarize(
    mean = mean(points),
    sd   = sd(points),
    n    = n(),
    .groups = "drop"
  ) |>
  mutate(
    lcl = mean - 2 * sd / sqrt(n),
    ucl = mean + 2 * sd / sqrt(n)
  )

points |> arrange(desc(mean))
# A tibble: 8 × 6
  number  mean    sd     n   lcl   ucl
   <dbl> <dbl> <dbl> <int> <dbl> <dbl>
1      5 26.5  7.34   1000 26.1  27.0 
2      8 13.5  7.87   1000 13.0  14.0 
3      2 12.0  5.34   1000 11.7  12.4 
4      1  6.27 3.82   1000  6.03  6.52
5      3  3.86 2.43   1000  3.70  4.01
6      7  3.55 2.13   1000  3.41  3.68
7      6  1.22 0.639  1000  1.18  1.26
8      4  1.04 0.326  1000  1.02  1.06

These simulations depend largely on your probability model.